Difference Between Quantile, Quartile, and Percentile
Quartile vs. Quantile vs. Percentile
In statistics, we often come across terms such as Quartiles, Quantile, and Percentiles, and often they are confusing to understand.
Quartiles, quantiles, and percentiles are used to describe the distribution of data, and particularly useful in understanding the spread, relative position, and central tendency of data.
The differences between quartiles, quantiles, and percentiles can be explained as follows:
Quartile
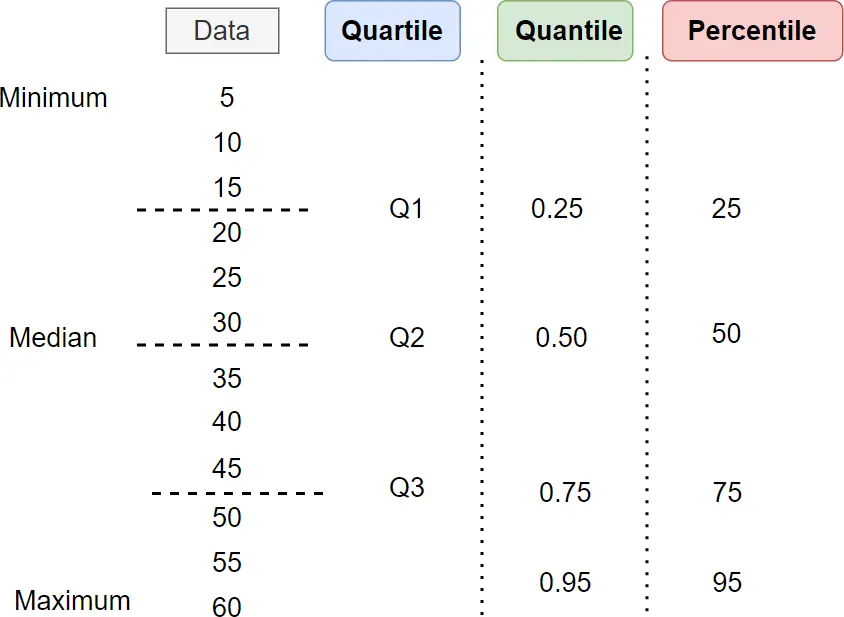
- Quartiles divide a dataset into four equal parts, each containing 25% of the data.
- Three quartiles (Q1, Q2, and Q3) are commonly used, which divide a dataset into four equal parts.
- The Q2 (second quartile) is also known as median.
- The Q0 and Q4 represents the minimum and maximum values in the dataset.
- The Q1 is a value below which contains the 25% of the data falls.
Quantiles
- Quantiles divide the dataset into any number of equal parts.
- Quartiles and percentiles are parts of quantiles.
- For example, quartiles, quintiles, deciles, and percentiles split the data into 4, 5, 10, and 100 equal parts
- Quantiles are typically expressed as decimal values and range from 0 to 1.
- The 0.25 quantile is a value below which contains the 25% of the data falls.
Percentiles
- Percentiles divide the data into 100 equal parts.
- Percentiles are typically expressed as whole numbers and range from 0 to 100.
- The 25th percentile is equivalent to the 0.25 quantile and first quartile (Q1). Similarly, the 50th percentile is equivalent to the 0.5 quantile and second quartile (Q2).
- The 25th percentile is a value below which the 25% of the data falls.
How to calculate the quartiles, quantiles, and percentiles?
Suppose you have the following dataset,
x <- c(37, 87, 17, 32, 65, 58, 52, 84, 41, 37)
You can calculate the dataset’s quartile, quantile, and percentile using the built-in quantile()
function.
Calculate the second quartile (Q2) or median. The quantile of Q2 is 0.5.
quantile(x, 0.5)
# output
 50%
46.5
The Q2 is 46.5. It means that 50% of the values in the dataset are below 46.5.
Calculate the 95th percentile. The quantile of the 95th percentile is 0.95.
quantile(x, 0.95)
# output
  95%
85.65
The 95th percentile is 85.65. It means that 95% of the values in the dataset are below 85.65.
When to use quartiles, quantiles, and percentiles?
The quartile should be used to understand the spread and distribution of data. For example, if your goal is to identify the median score of students, what is the minimum and maximum score, and how many students are in the top 25%?
The quantile should be used to understand the spread and distribution of data beyond the quartile. For example, if your goal is to create five groups (quintiles) of students based on score to understand the score distribution. In this case, each group will contain 20% of students.
The percentile should be used for comparing position/ranking among the population. For example, percentiles are often used for scoring national exams. If the student scores 95th percentile, it means the student’s score is higher than 95% of the students who took the exam.
Overall, quartile and quantile are useful in understanding the data’s distribution, while percentile is useful for understanding the relative positions of data points.
Related: Calculate Quartiles in R
Enhance your skills with courses on Statistics and R
- Introduction to Statistics
- R Programming
- Data Science: Foundations using R Specialization
- Data Analysis with R Specialization
- Getting Started with Rstudio
- Applied Data Science with R Specialization
- Statistical Analysis with R for Public Health Specialization
This work is licensed under a Creative Commons Attribution 4.0 International License
Some of the links on this page may be affiliate links, which means we may get an affiliate commission on a valid purchase. The retailer will pay the commission at no additional cost to you.