ComplexHeatmap: Create Complex Heatmaps in R
Heatmap is a statistical visualization method for visualizing complex data sets in matrix form and quickly gaining insights from large datasets.
Heatmaps are widely used in bioinformatics for analyzing and visualizing large gene expression datasets obtained from different samples and conditions.
This tutorial explains how to use the Heatmap() function from the ComplexHeatmap
R Bioconductor package for visualizing complex heatmaps.
Install ComplexHeatmap
You can install the ComplexHeatmap R package (from Bioconductor) as below:
if (!require("BiocManager", quietly = TRUE))
    install.packages("BiocManager")

BiocManager::install("ComplexHeatmap")
Getting the dataset
We will use the sample RNA-seq gene expression dataset for creating heatmaps using the ComplexHeatmap package.
# load dataset
df = read.csv("https://reneshbedre.github.io/assets/posts/heatmap/hm_data.csv", row.names="Gene")
# convert to matrix
df_mat = data.matrix(df)
# view first few rows of data
head(df, 5)
# output
             A         B         C        D        E         F
B-CHI1 4.505700  3.260360 -1.249400  8.89807  8.05955 -0.842803
CTL2-1 3.508560  1.660790 -1.856680 -2.57336 -1.37370  1.196000
B-CHI2 2.160030  3.146520  0.982809  9.02430  6.05832 -2.967420
CTL2-2 1.884750  2.295690  0.408891 -3.91404 -2.28049  1.628820
CHIV1  0.255193 -0.761204 -1.022350  3.65059  2.46525 -1.188140
Basic heatmaps
Create and visualize a single heatmap with the default settings,
# load package
library(ComplexHeatmap)
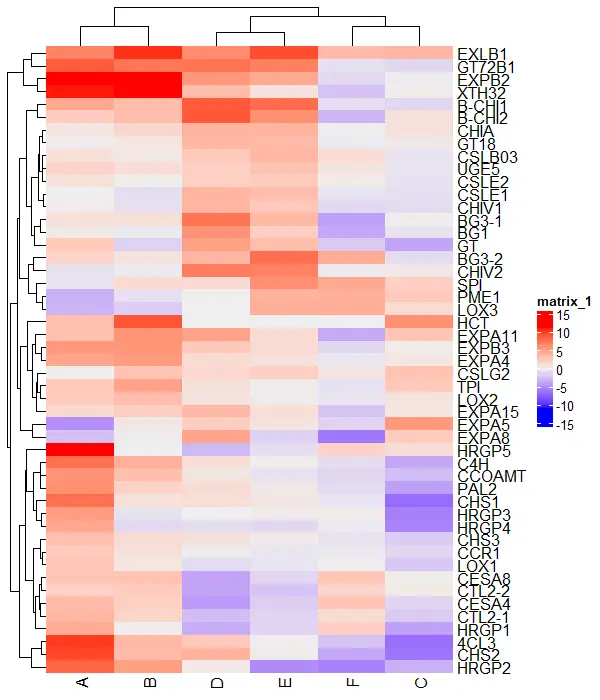
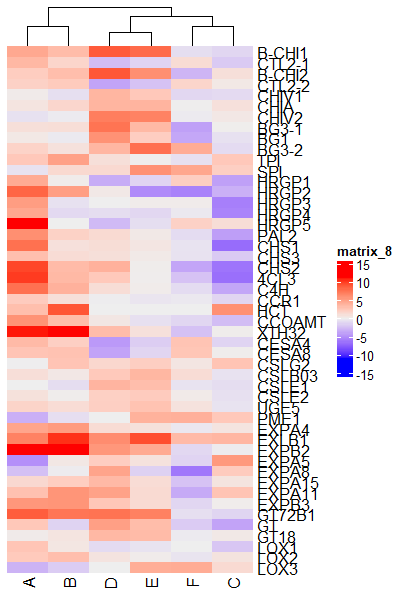
# visualize heatmap
Heatmap(df_mat)
Change color of the heatmap
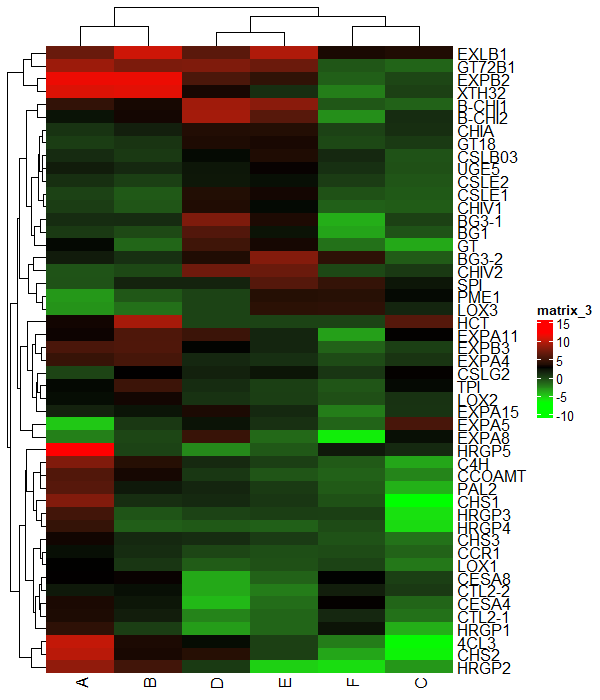
You can change the color of the heatmap using the col argument
# create color scale
library(circlize)
col_fun = colorRamp2(seq(min(df_mat), max(df_mat), length = 3),
                     c("green", "black", "red"))

# visualize heatmap
Heatmap(df_mat, col = col_fun)
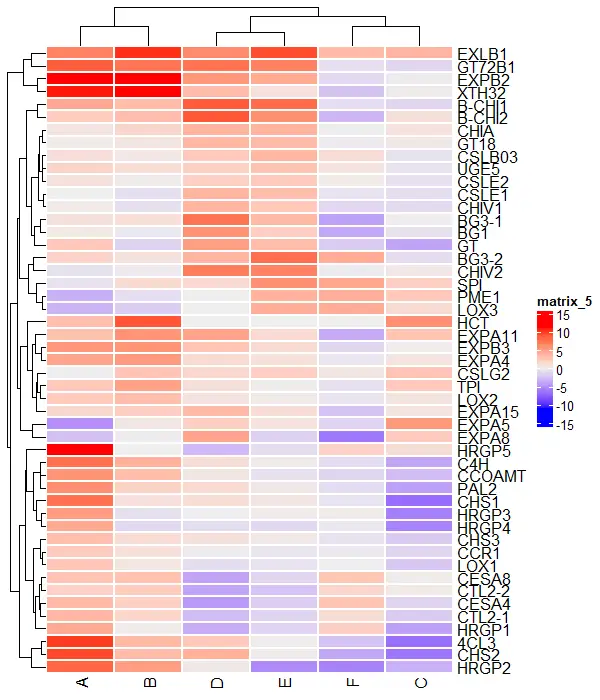
Change borders of the heatmap
You can change the individual cell borders of the heatmap using the rect_gp argument
Heatmap(df_mat, rect_gp = gpar(col = "white", lwd = 2))
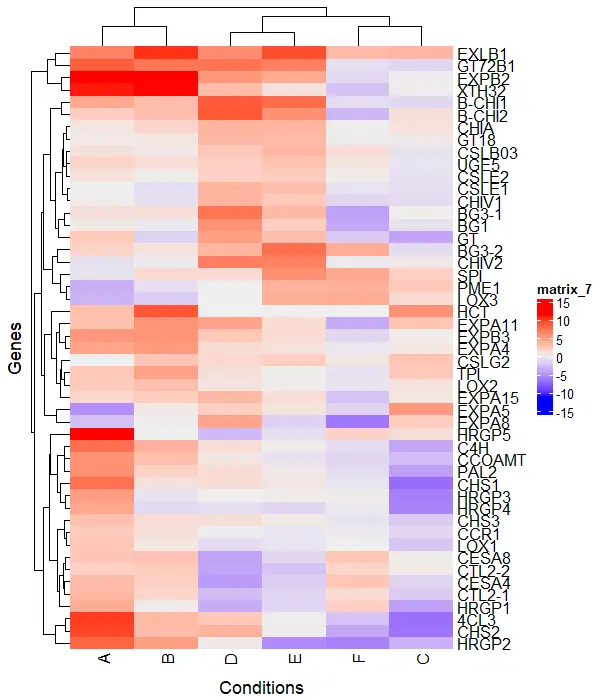
Add titles to the heatmap
You can add row and column titles to the heatmap using the column_title and row_title arguments
Heatmap(df_mat, column_title = "Conditions", row_title = "Genes",
        column_title_side = "bottom")
Clustering
The row and column clustering is plotted by default in ComplexHeatmap.
You can turn off row and column clustering using cluster_rows and show_column_dend arguments
# turn off row clustering
Heatmap(df_mat, cluster_rows = FALSE)

# turn off column clustering
Heatmap(df_mat, show_column_dend = FALSE)
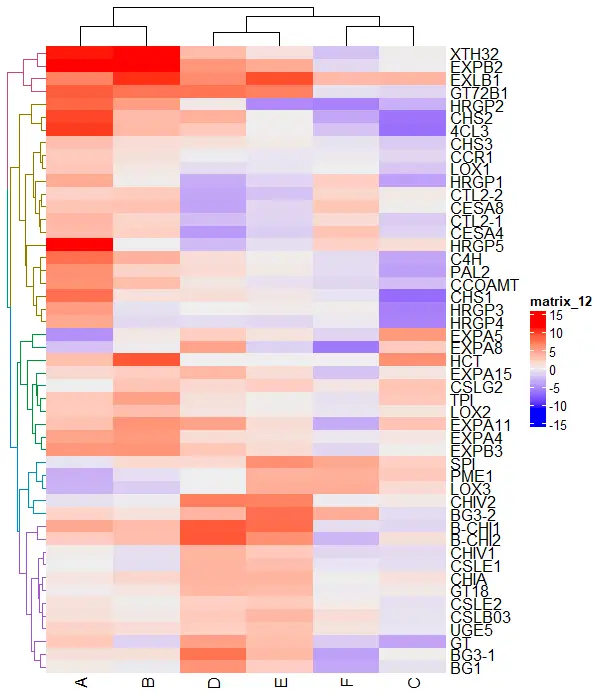
Color the clusters
You can also color the individual row clusters,
# install.packages("dendextend")
library(dendextend)
row_dend = as.dendrogram(hclust(dist(df_mat)))

# color row clustering
Heatmap(df_mat, cluster_rows = color_branches(row_dend, k = 5))
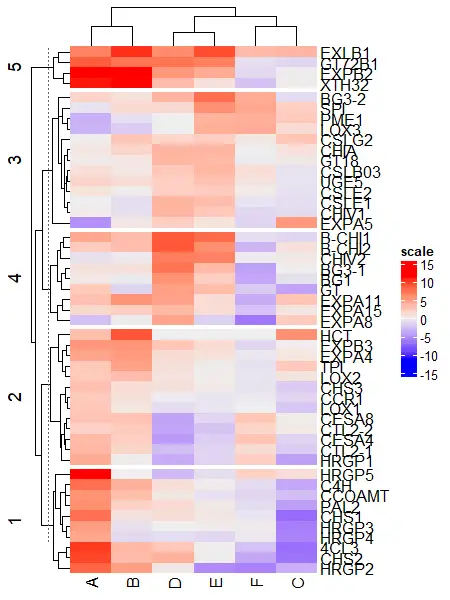
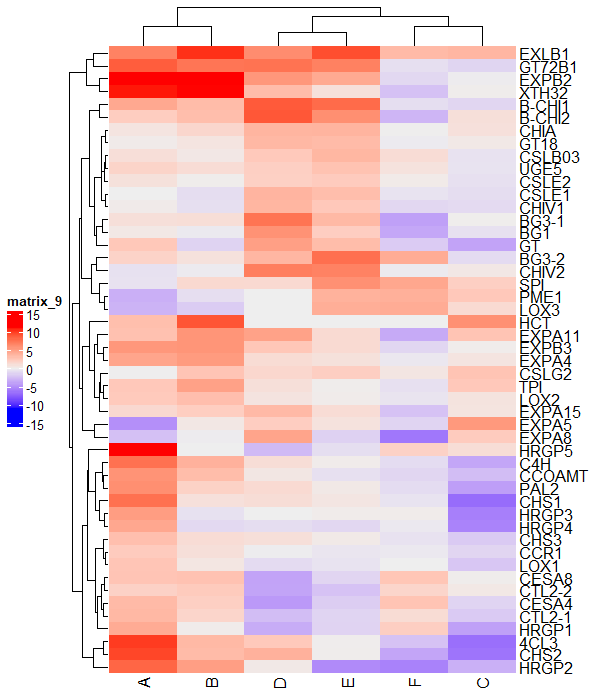
Split the heatmaps
You can also split the heatmap by rows and columns to better understand the clustering of the data. It uses k-means clustering to split the clusters.
# split row clusters
Heatmap(df_mat, name = "scale", row_km = 5)

# split column clusters
Heatmap(df_mat, name = "scale", column_km = 2)
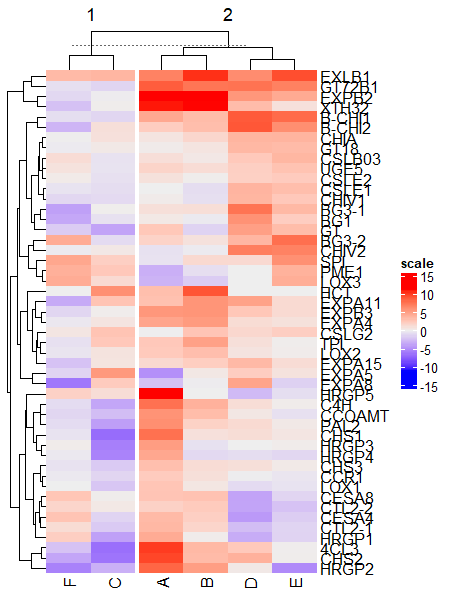
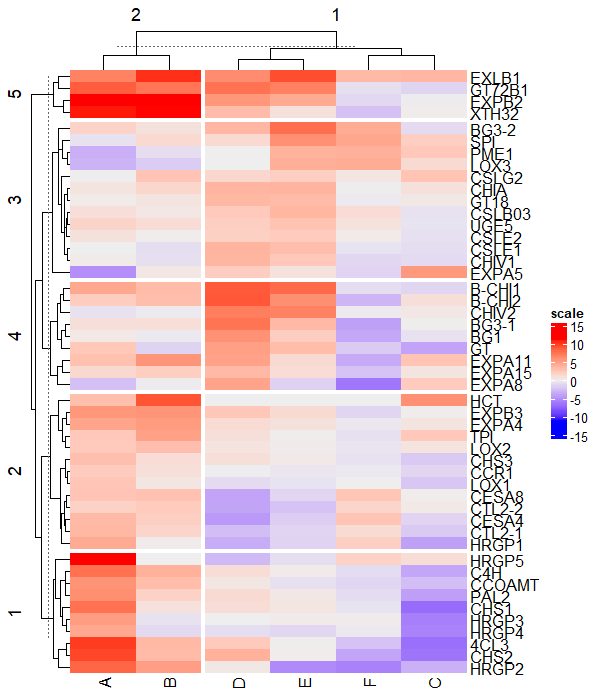
Split by both rows and columns simultaneously,
# split row and column clusters at same time
Heatmap(df_mat, name = "scale", row_km = 5, column_km = 2)
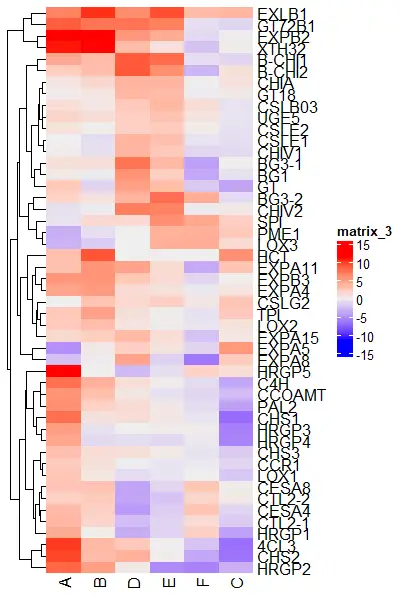
Change legend position
You can change the legend position in the ComplexHeatmap as below,
draw(Heatmap(df_mat), heatmap_legend_side = "left")
Similarly, you can use the bottom and top positions to adjust the legend position.
Related: pheatmap: create annotated heatmaps in R
Enhance your skills with courses on genomics and bioinformatics
- Genomic Data Science Specialization
- Biology Meets Programming: Bioinformatics for Beginners
- Bioinformatics Specialization
- Command Line Tools for Genomic Data Science
- Introduction to Genomic Technologies
This work is licensed under a Creative Commons Attribution 4.0 International License
Some of the links on this page may be affiliate links, which means we may get an affiliate commission on a valid purchase. The retailer will pay the commission at no additional cost to you.